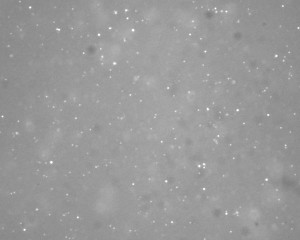
THIS IS EXPERIMENTAL, UNPUBLISHED SOFTWARE. USE AT YOUR OWN RISK.
I’ve written a free, open source script for ImageJ (free, open source) to count viruses (or bacteria, but not both at the same time) automatically from JPEG image files. If you have TIFFs you can batch convert them to JPEG using ImageMagick (free, open source) with the following command:
You can download the script here as a text file (JVirusCount), or the full source is written below. Opened in ImageJ (after opening any image in the desired directory), it will iteratively adjust the noise threshold and use the “Find Maxima” command to count the number of dots in every image file in the desired directory.
The output of the script is a tab-delimited text file for each image summarizing the number of dots detected at each threshold, which can be input into a Matlab (not free, closed source) script (MVirusCount) using an external function, regress2lines (free, open source). I haven’t tried using it with Octave (free, open source) but if you get it to work let me know. What I’ve found is that there is a significant change in the slope of this curve during the transition from measuring ‘noise’ to ‘particles’, but that it depends on the quality, brightness, and contrast of the image; MVirusCount determines the intersection of those two lines and the abundance of dots at that point. A program finding the maximum of the first derivative of the curve would likely work just as well or better.
As seen below, the program has the lowest relative error at high concentrations of viruses, and should probably not be used at concentrations less than 100 viruses per field without further testing. I should also note that the samples shown above are field samples from an extreme environment, so usage in a laboratory setting may be more precise.

for (i=0; i<list.length; i++) {
run("Clear Results");
run("Set Measurements...", " decimal=9");
for (noise=1; noise<42; noise++) {
run("Find Maxima...", "noise=" + noise + " output=Count");
rows = nResults-1;
setResult("Noise", rows, noise);
counts = getResult("Count", rows);
setResult("logcount", rows, log(counts));
}
title = getTitle();
saveAs("Measurements", File.directory + title +".csv");
run("Open Next");
}
d=dir('*jpg.csv');
for k=1:length(d);
fname=d(k).name;
counts = dlmread(fname,'\t',1,0);
counts(end,:)=[];
counts(:,end)=[];
% from 10:end because it has sigmoidal shape screwing things up
[m, R, idiv, G] = regress2lines(counts(10:end,3),counts(10:end,4));
xy = [1, m(5); (m(1)*1+m(2)), (m(1)*m(5)+m(2)); m(5), 40; (m(3)*m(5)+m(4)), (m(3)*40+m(4));];
store_fname{k,1} = fname;
store_intercept(k,1) = m(5);
store_count(k,1) = exp((m(1)*m(5)+m(2)));
% subplot(1,length(d),k)
hold off
plot(counts(:,3),counts(:,4),'bs')
hold on
plot(xy(1,:),xy(2,:),'b-')
plot(xy(3,:),xy(4,:),'r-')
title({fname});
drawnow
pause
end
fid = fopen('output.csv','a');
for k=1:length(store_fname);
fprintf(fid,'%s\t%0.5g\t%0.5g\n', store_fname{k}, store_intercept(k), store_count(k));
% sprintf('%s\t%0.5g', store_fname{k}, store_intercept(k))
end
Tags: 4 Comments


4 responses so far ↓
This looks really interesting as I am learning to write IJ macros and in particular open sequences of images performing a task each time. Do you have any good resources? The IJ site and wiki seem pretty useful. G
Good luck, I’m afraid I don’t know of any good resources, I just learned by looking at some example scripts I found on the web.
Eric, just found your web site.
It’s good to see people posting their code to help others.
My only concern is why did you choose to process JPG images?
JPG images can have artifacts from lossy compression that can cause IA problems. TIF images are more generally used.
Hi John, thanks for pointing that out. I remember spending some time trying to get the TIFF’s to work directly but for some reason I couldn’t figure it out. I’m not very experienced with ImageJ though, so If you have any tips I’d be pleased to include them here. cheers